Smart Grid SimLab
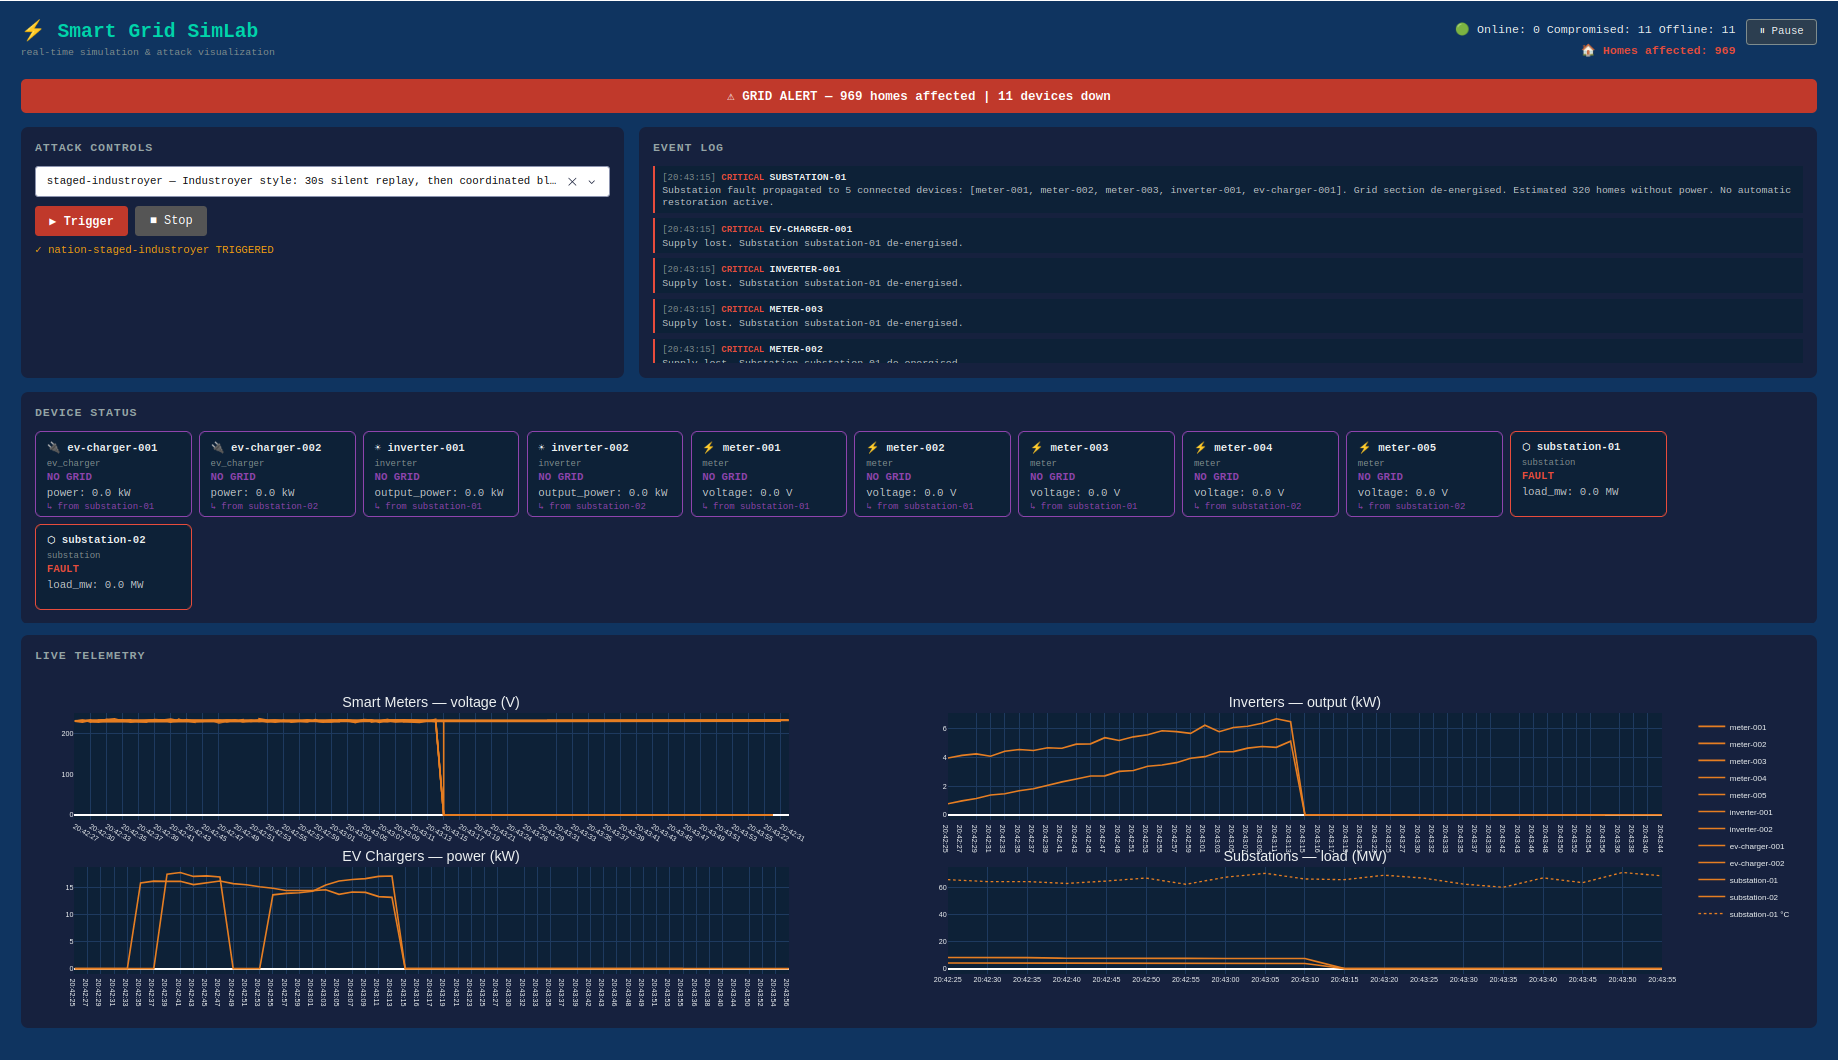
The gap between what the dashboard shows and what the grid is doing is where every incident in this section operates. The Smart Grid SimLab makes that gap visible, on a live dashboard, to an audience that does not need to know what Modbus is.
Being told that attackers can manipulate sensor data is one thing. Watching the voltage lines spike and flatline while the physical grid is fine is another.
The topology
Two substations, five smart meters, two solar inverters, and two EV chargers, all publishing telemetry over MQTT on a simulated day cycle. The attack engine sits between the simulator and the dashboard. All telemetry passes through it. When an attack fires, the engine modifies the data in transit before the dashboard receives it, the same position a real attacker would occupy after compromising a SCADA data path.
No physical devices, no real protocols on the wire, no actual Modbus or DNP3. The grid is synthetic and the consequences are visual only.
The attack library
Fourteen basic techniques and fourteen nation-state scenarios, each triggerable from the dropdown or via REST.
Basic techniques
The building blocks: telemetry spoofing, forced shutdown, demand injection, frequency falsification, cascading substation failure, Modbus register write, data replay and freeze, protection relay bypass, SIS offline, wiper, and ransomware. Each produces a distinct dashboard signature: a colour change, a flatline, a climbing temperature chart, or a total blackout.
Modbus write is the plainest. No exploit, no malware. The protocol carries no authentication. Sending a write command to a register requires only network access. FrostyGoop, which knocked out heating for 600 flat buildings in Lviv in January 2024, worked the same way.
Nation-state scenarios
Fourteen scenarios, each modelled on a documented incident or malware family. Ukraine 2015 fires cascading failures on both substations simultaneously, the defining characteristic of the Sandworm attack. Industroyer stages it: 30 seconds of data replay while operators see a stable grid, then simultaneous blackout with no warning.
Volt Typhoon runs 120 seconds of dwell before the collapse, a compressed representation of the years-long access the group maintained.
Stuxnet is the one that takes time. The transformer temperature chart climbs gradually from around 65°C toward the 112°C trip threshold over two minutes, reporting nothing alarming until it trips. The destruction is already underway before anything on screen suggests a problem.
The Triton full kill chain completes the sequence the actual malware did not. Both SIS cards go purple for 20 seconds; then the cascade fires with nothing to stop it. In the real 2017 incident a logic error in the payload triggered a fail-safe state and gave the attack away. Here it runs cleanly.
Consequence and context
Each attack carries a tooltip in the dropdown describing the real incident behind it. The sequencing and behaviour of each scenario reflects how the documented attack worked.
The combination of live visual consequence and incident context covers ground that neither a slide deck nor a lab exercise quite reaches. A non-technical audience can follow the dashboard without understanding Modbus. A technical audience can run the scenarios, read the included attack reference, and compare the simulation’s behaviour against published incident reports.
The Pause button freezes the dashboard mid-scenario, useful when something worth discussing is on screen and the data would otherwise race past it.
The scenario list grows alongside the incident record. A documented attack with a clear pattern and sufficient public technical detail becomes a scenario eventually. The library is not finished because the incidents are not.
Setup
Requires Docker and Python 3.11+.
docker compose up -d broker
pip install -r requirements.txt
python -m simulator.main &
python -m attacks.engine &
python -m dashboard.app
The dashboard comes up at http://localhost:8050. Or run everything at once:
docker compose up --build
The SimLab repository can be found at github.com/tymyrddin/smart-grid-sim. Last updated: 23 May 2026